


News & Tips•May 2, 2021, 2:08 p.m. • 51
Make the Most Of Your Training With Insights
Trackster's Insights feature gives you the most crucial data so that you don't get lost in the weeds and get the knowledge you need to improve.
Hot take: modern sports have become too data obsessed. Sure, the wonders of chip and computing technologies have made world class training resources available to the mass, and yes, data can help you make improvements. But the focus on metrics has come at the expense of building mental fortitude, embracing the grind, and learning to be in tune with your body.
That being said, there is a proper place for data in your training. Maybe you've just been injured and want to see if you raised mileage too quickly. Or you ran a lot of hills last year, ran a big PR, and want to see how much elevation gain you had done in the build up to your big breakthrough. While obsessing over these stats daily can be an impediment, analyzing accumulated data and training insights can be pivotal in your athletic growth.
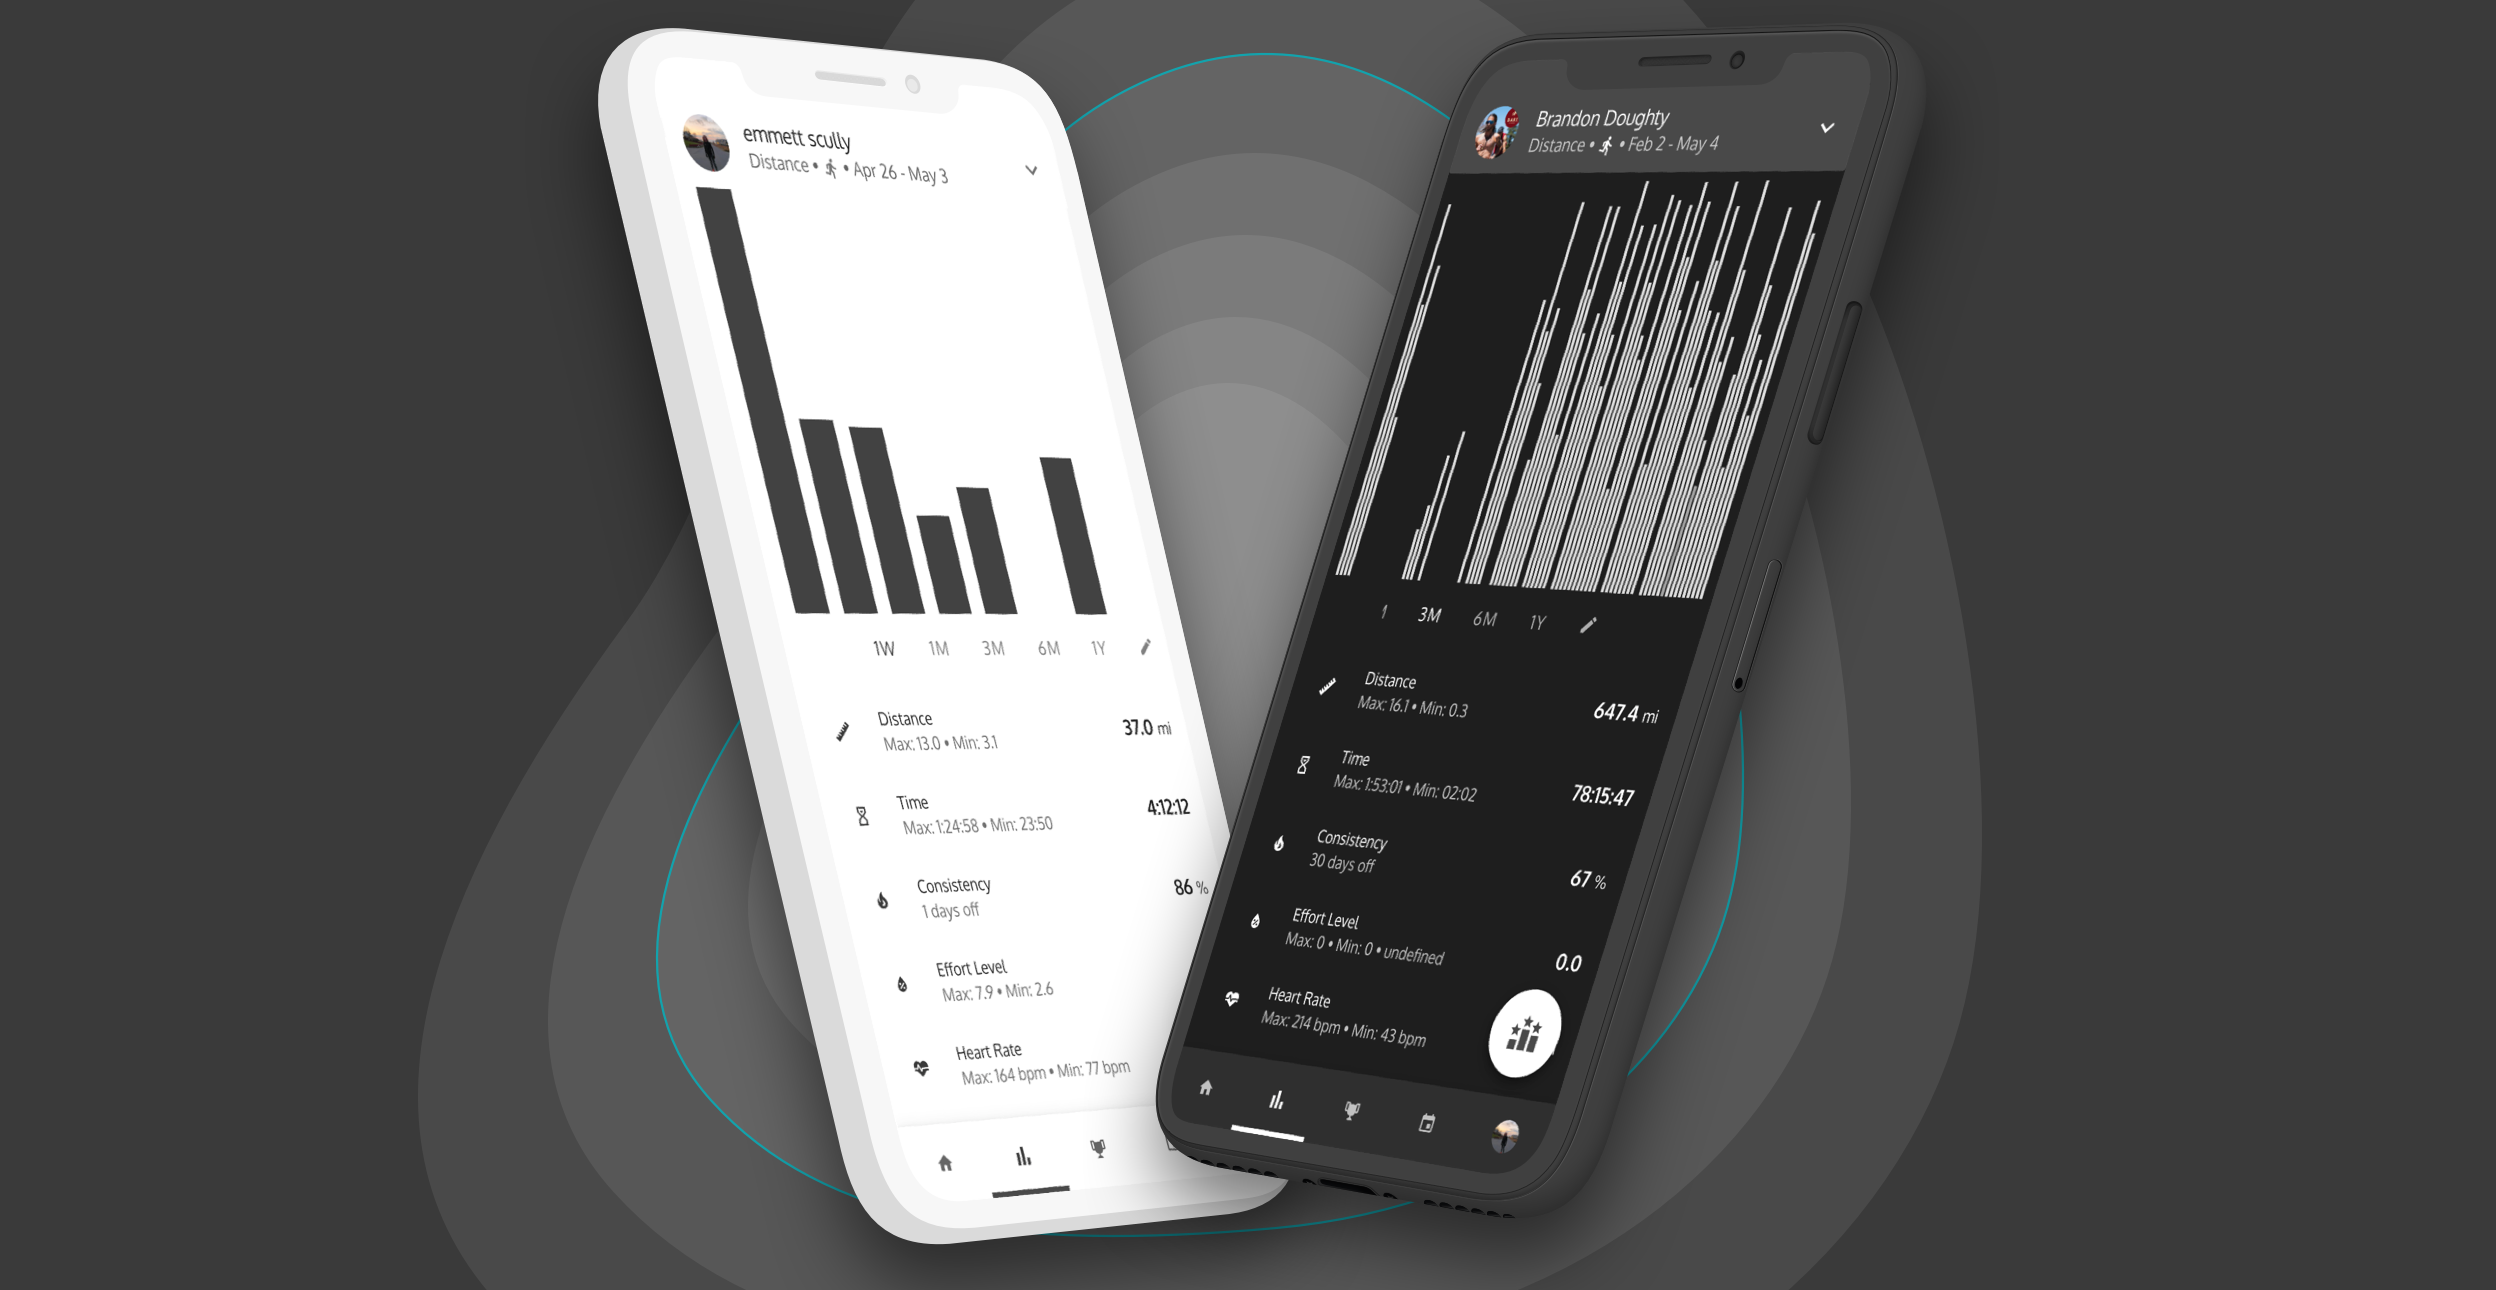
The Insights feature of Trackster, we've struck the perfect balance of data and presentation to give you the most helpful break down of your training. Here's a few of the useful training insights we offer.
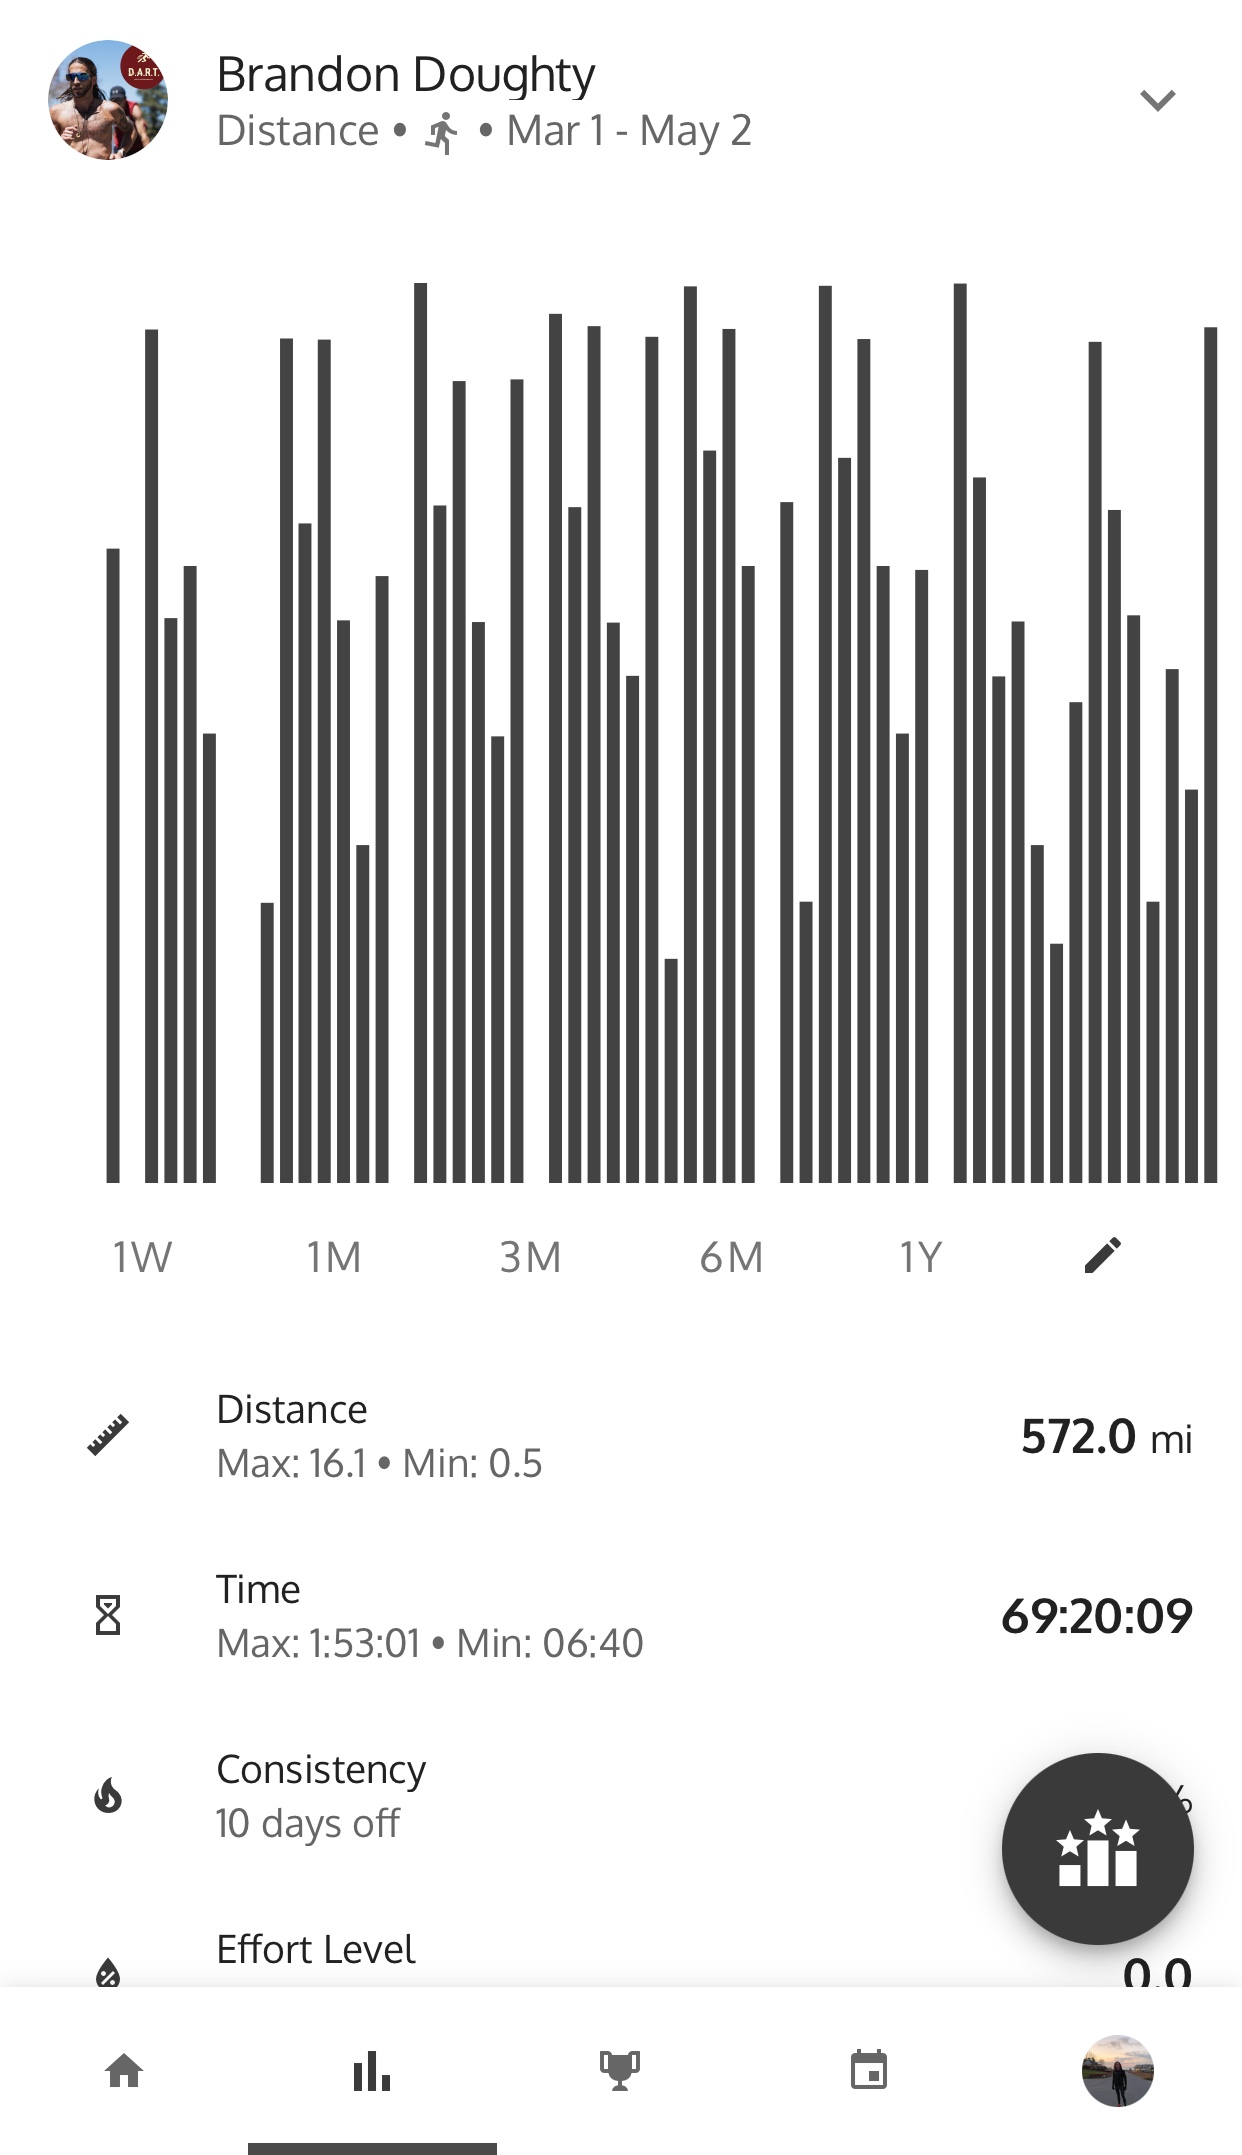
UA Dark Sky Distance Pro Runner - Brandon Doughty's stats
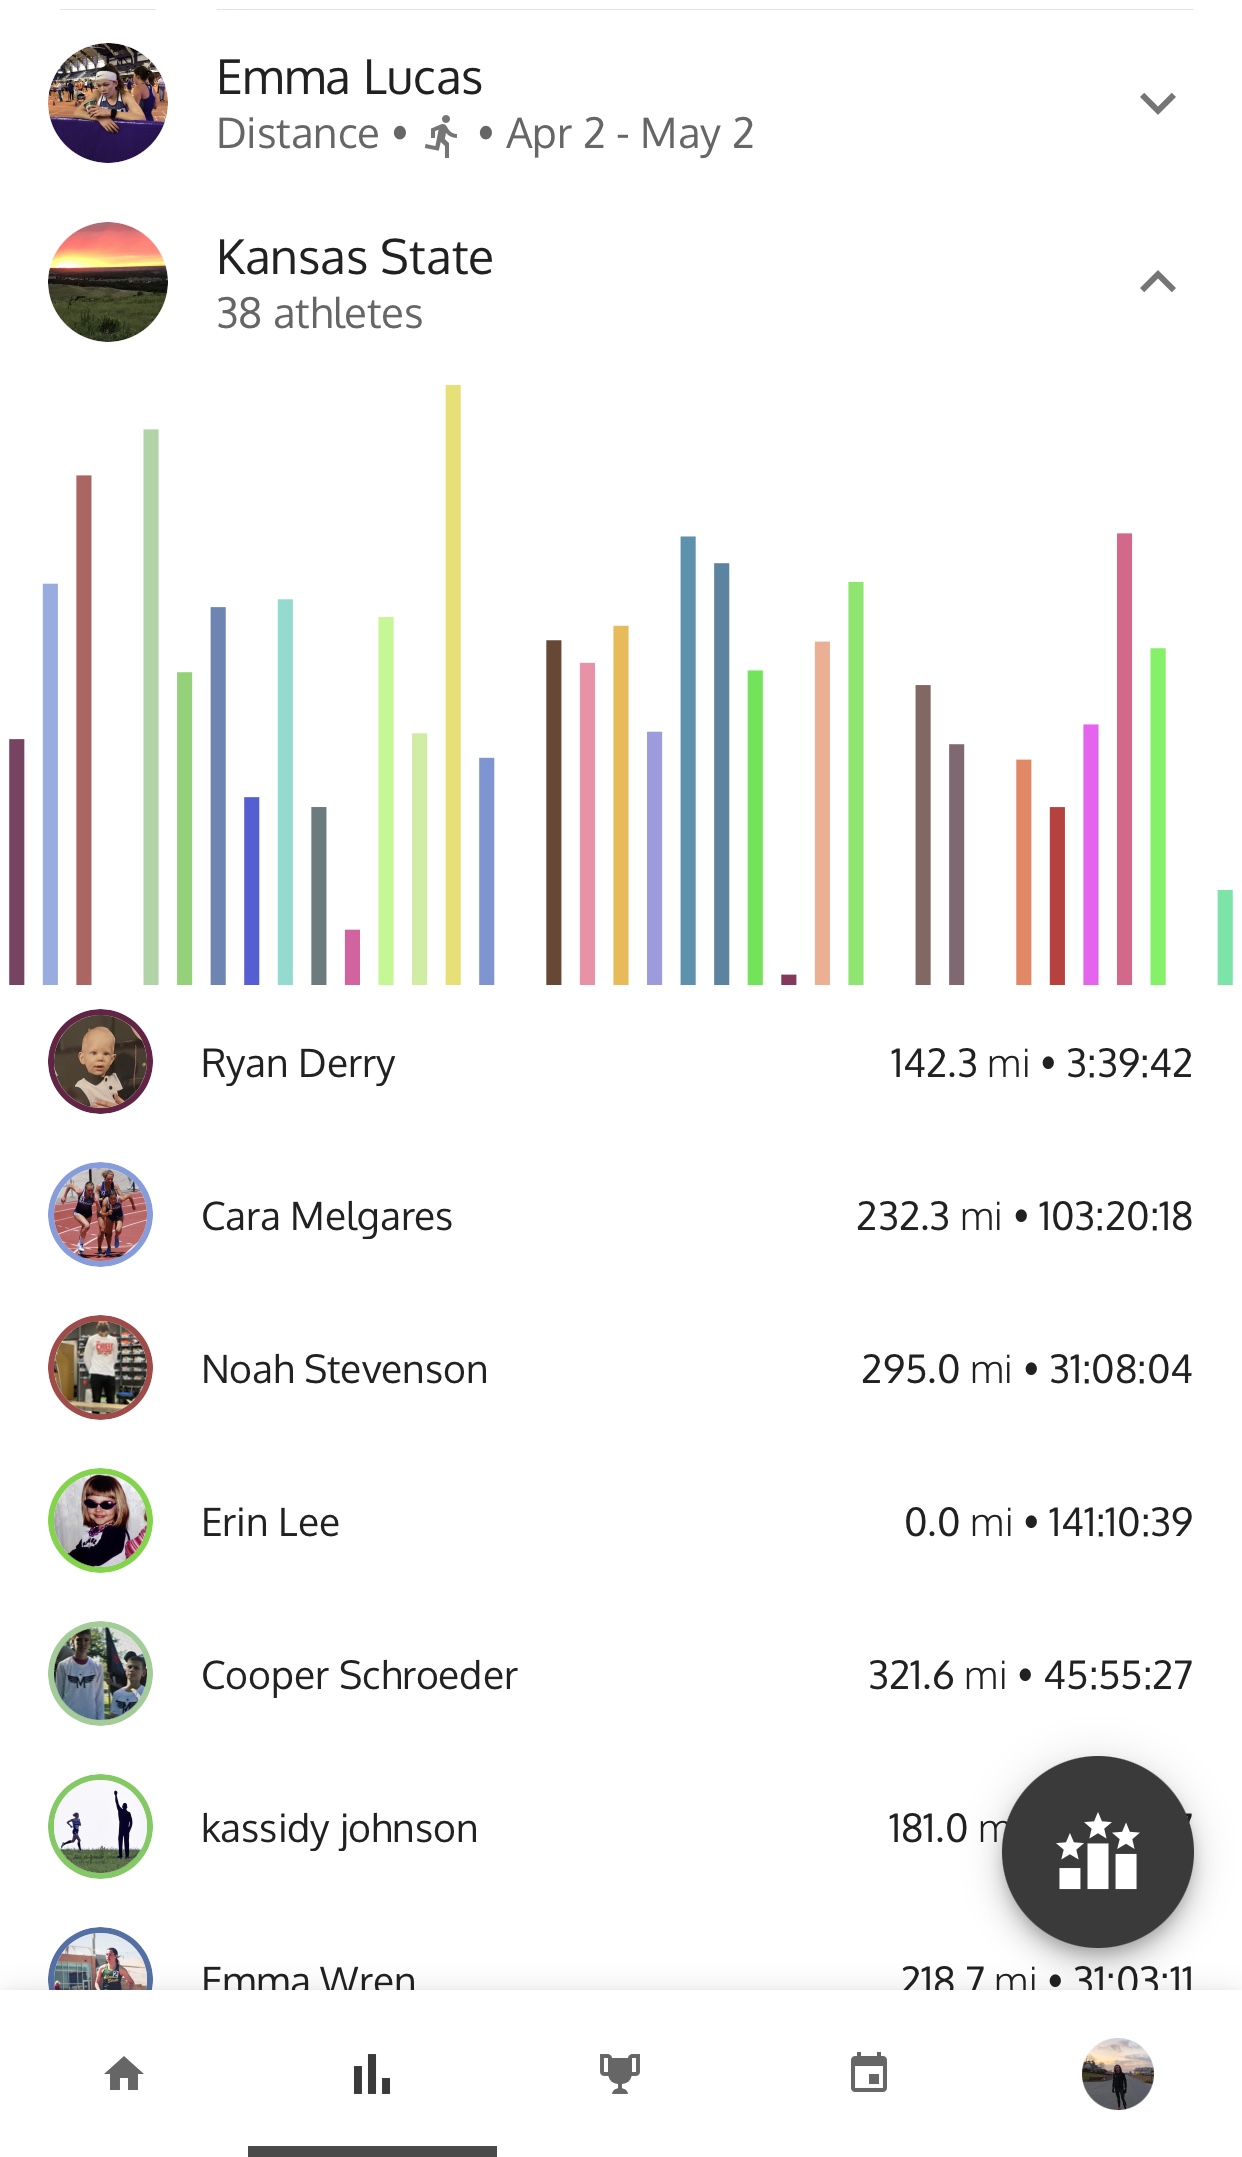
Sometimes looking at a number doesn't give you the same information as a visual representation. With our mileage graph, you can view your weekly, monthly, or yearly mileage in a bar graph. Additionally, you can also customize the graph to the dates and activity you want to see in order to maximize your insights. (For example, if you're injured and want to see what bike workouts you've done in the past when hurt, you can select "Bike" and the data for all your bike workouts will pop up).
Tap on any bar to view the date and mileage from that day. Viewing the overall ebbs and flows of your mileage not only gives you information about how to better structure your training, but also can be a good visual reminder of all the work you've put in and how far you've come!
Screen shot of data below graph
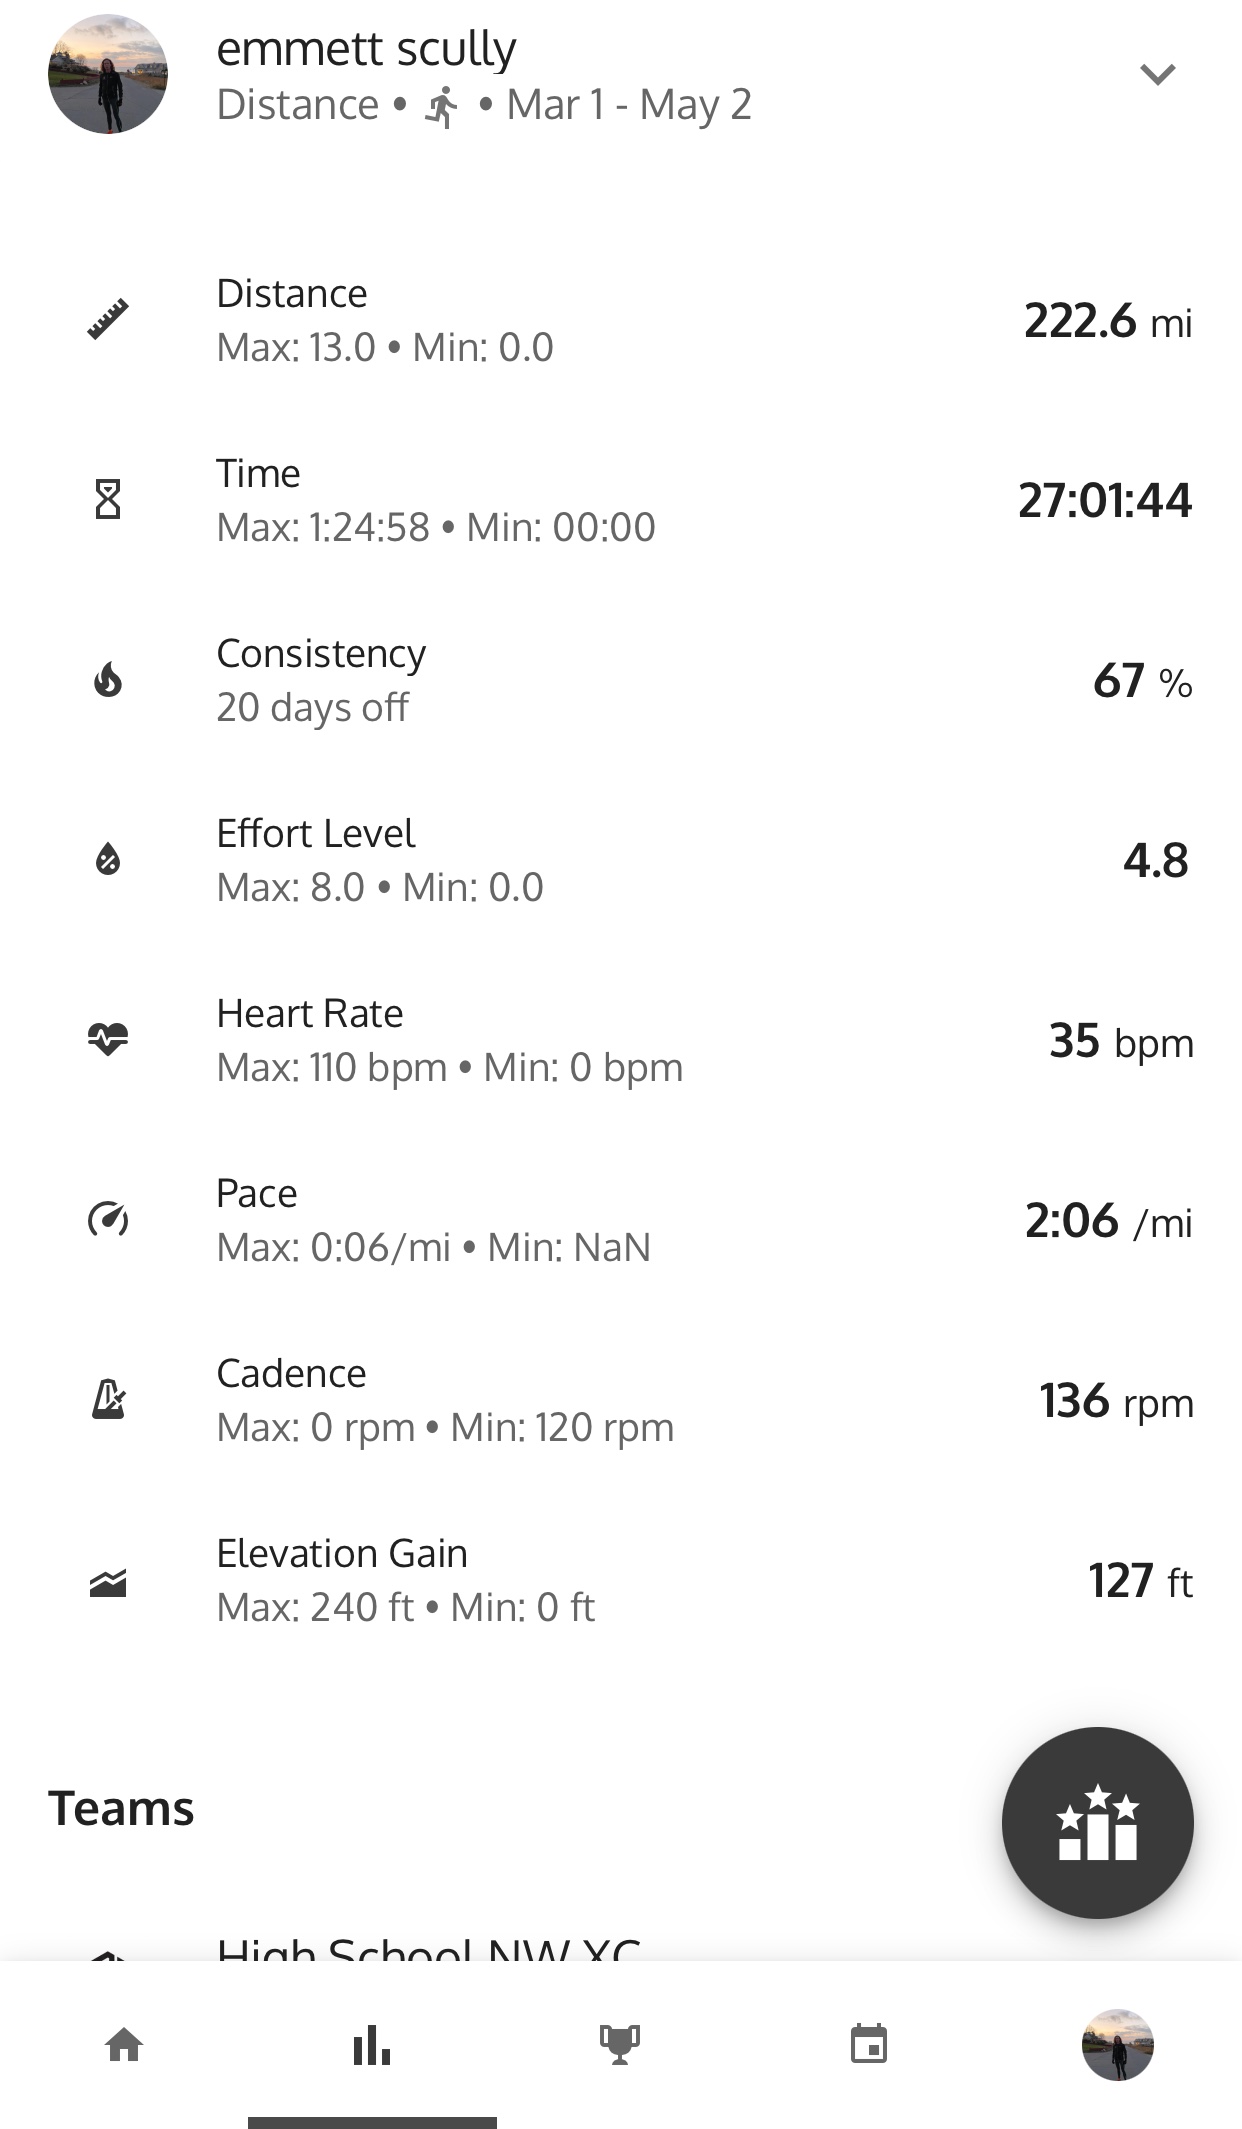
Trackster founder Emmett Scully's data, below the training graph
Additionally, you can also see the numbers for your mileage, pace, elevation gain, consistency, and more for each period of time you select.
The best team's training data for the last month
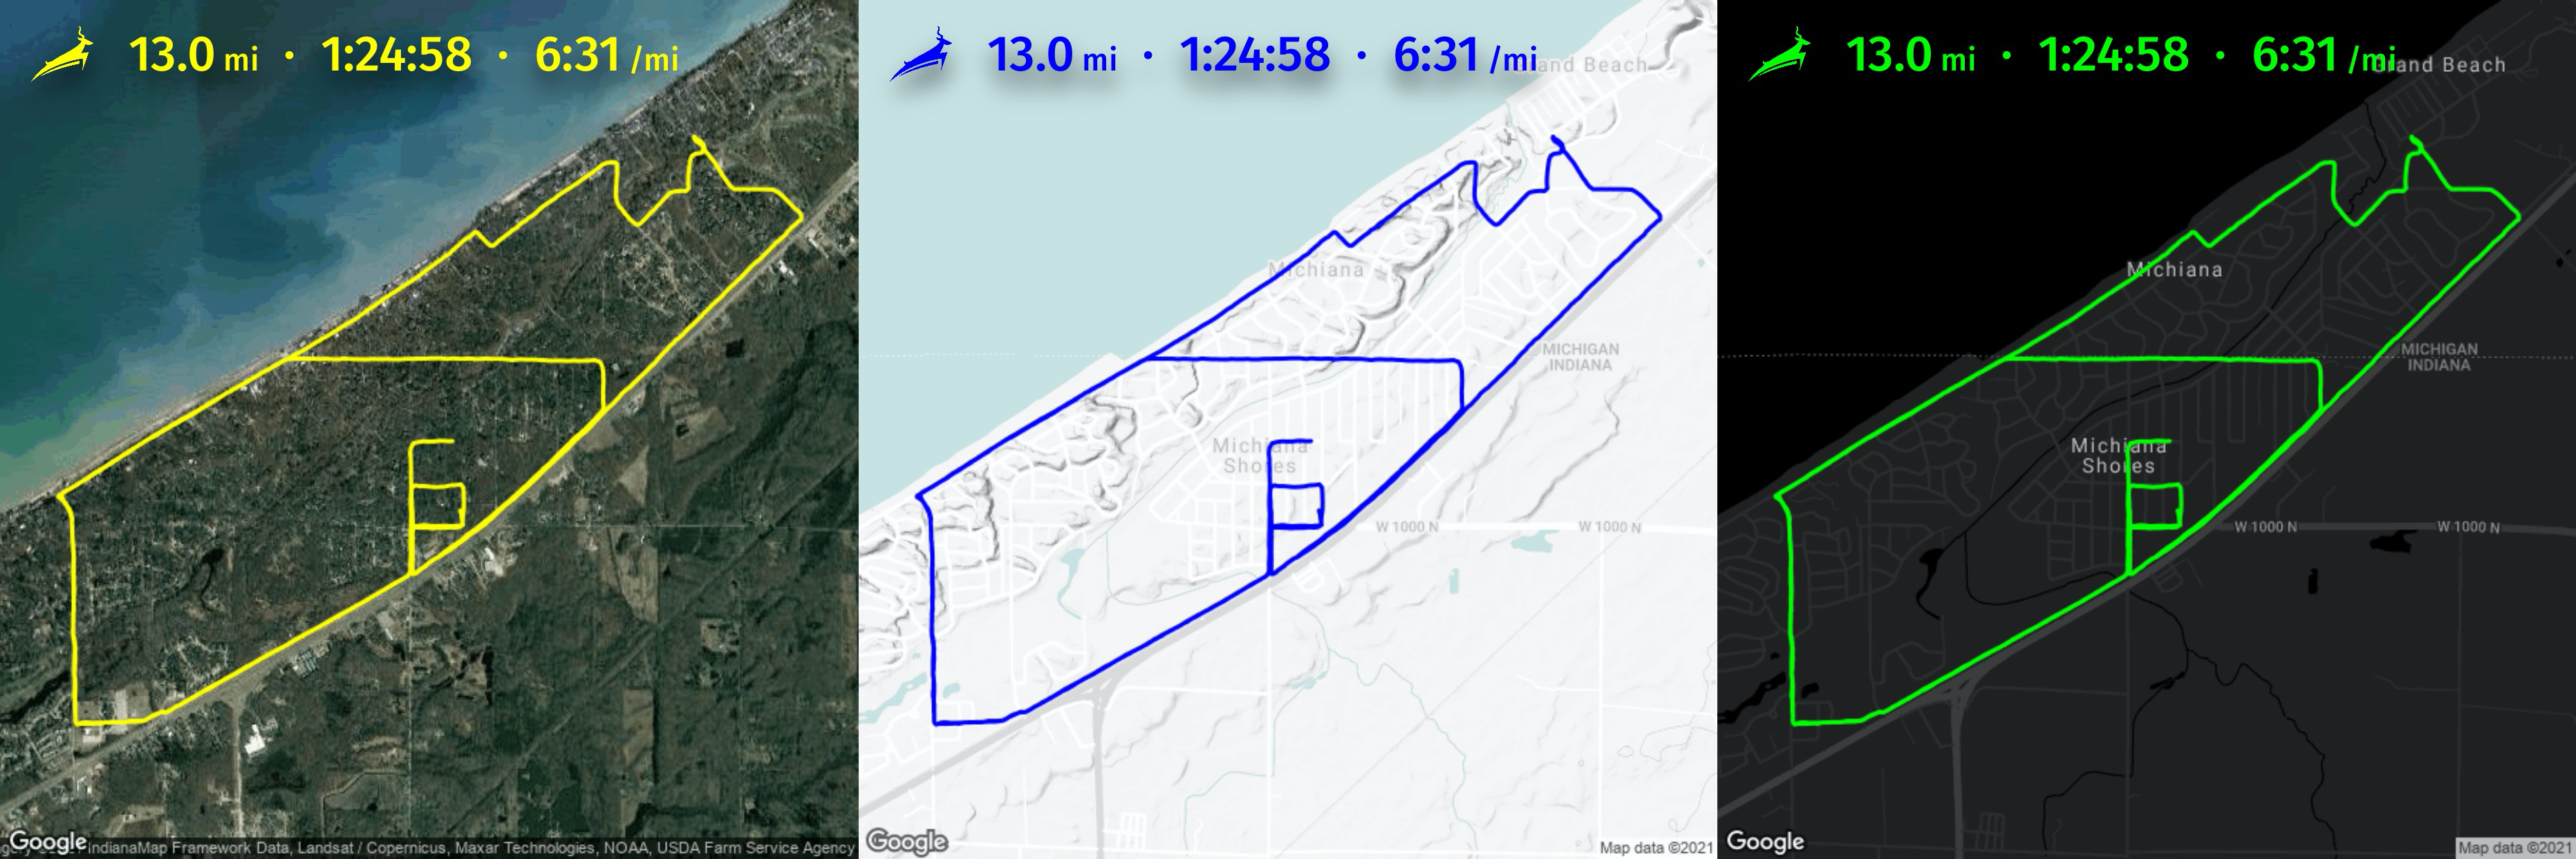
Finally, you can see your mileage compared to your teammates, see what mileage your shoes are at, and view the GPS routes for your runs!
With the right balance, knowledge and perspective, training data can both improve your training and give you the motivation and encouragement of seeing all your hard work! Our Insights feature gives you the perfect balance and perspective on your data so that you get what you need from the numbers without getting caught up in them.